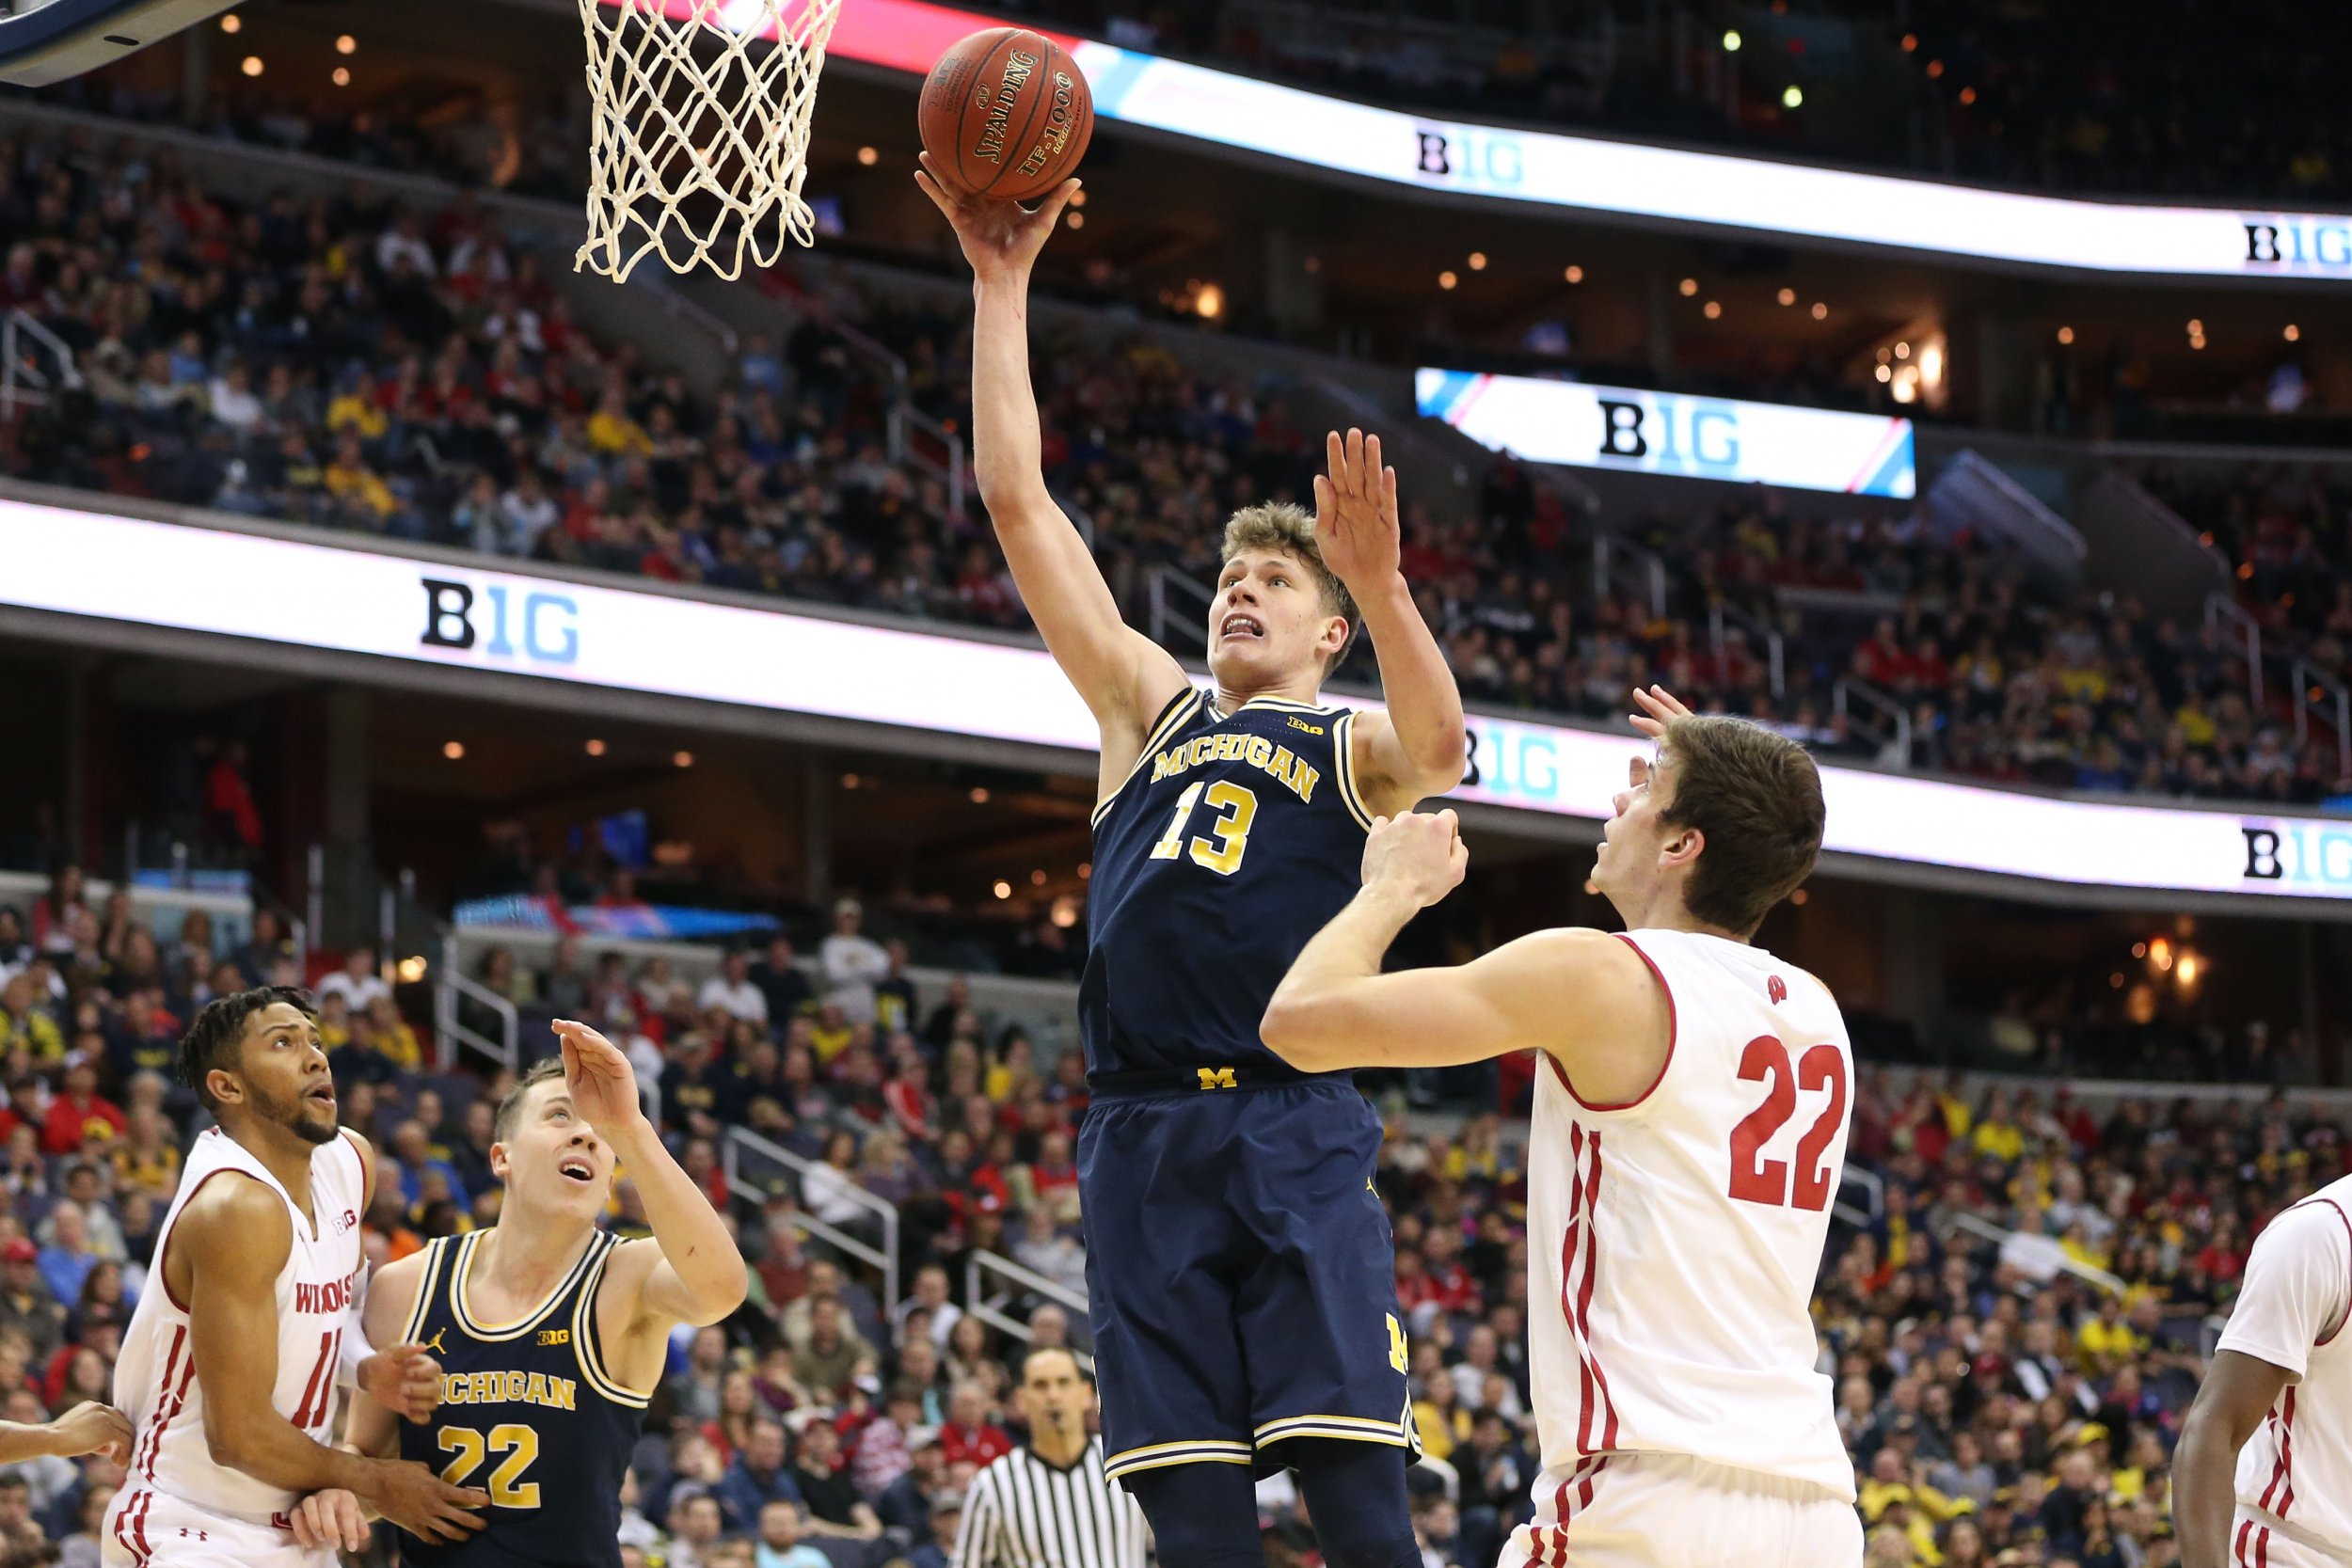
Every March Americans stumble through the process of filling out a bracket for the NCAA tournament. It's nearly impossible to feel informed—there are hundreds of Division 1 schools, 68 of which qualify for the big dance—and the act of deciding winners often devolves into less-than-educated guesses. But as the first four games are scheduled to get underway Wednesday, here are six graphs highlighting the key statistics to know both for a superior bracket and to better understand why the tournament might play out.
So: Use this breakdown of the important numbers to know, accompanied by helpful graphics courtesy of Graphiq, to win your office pool—or just sound like an expert.
Point differential
A popular benchmark stat among basketball aficionados, point differential is a good baseline for a team's quality. It's simply the difference between points scored and points allowed. Keep strength of competition in mind, however. For instance, Gonzaga has the best point differential of any team in the men's tournament but plays in a weaker conference than No. 1 overall seed Villanova, which plays in the Big East.
The big names
Sometimes one stunning player is enough to earn a team a few wins in March Madness. Think Stephen Curry and Davidson in 2008. The three players with the highest per-game scoring averages heading into the 2017 tournament—Mike Daum of South Dakota State, Keon Johnson of Winthrop and Sindarius Thornwell of South Carolina—all play for teams given a seven-seed or lower. But the fourth, fifth and sixth most prolific scorers play for traditional powerhouses Kansas, Kentucky and Duke, respectively.
Historical win percentages
To figure out the current tournament, it can be helpful to look at past tournaments. Graphiq broke down how often each seed wins in the first round and compared it to how often people select that seed. Note that 11, 12, 13 and 14 seeds typically win at a higher rate than people tend to expect.
Who makes the Final Four
Since 1985, Final Four teams had an average seed of 2.78. But five of the last seven tournaments have featured a Final Four with an average seed higher than the norm. Still, No. 1 seeds have reached the Final Four 52 times since 1985 compared to just 28 berths for No. 2 seeds.
The best shooters
In the midst of the NCAA tournament's frenzy, it's nice to have a reliable shooter. Graphiq put together a quick overview of the scorers with the best shooting percentages, both overall and from behind the three-point line.
Uncommon Knowledge
Newsweek is committed to challenging conventional wisdom and finding connections in the search for common ground.
Newsweek is committed to challenging conventional wisdom and finding connections in the search for common ground.
About the writer
Reporter, covering a bit of everything.
To read how Newsweek uses AI as a newsroom tool, Click here.


