This article first appeared on the Hoover Institution site.
Economic models predicting presidential elections used to do very well using only various measures of real income growth over the course of a presidential term, with growth in the last year of the term being most important.
A reason they worked is that most Americans evaluated past economic performance the same, so if the economy was good, the president or his party benefited at the ballot box.
In the 1980 presidential election, even though Democrats had a 16-point advantage over Republicans in Gallup (45.3 to 29.3 percent) and a 16.4-point lead in the American National Election Study, Ronald Reagan won handily because the U.S. economy was in bad shape.
Richard Nixon won overwhelmingly in 1972, even though there were 20 percent more Democrats than Republicans, because the economy was good and the Vietnam War was winding down.
Beginning somewhere in the George W. Bush administration, we began to see partisan differences on how the economy was doing, with Republicans more positive, Democrats pessimistic and independents in between.
In 1999, Yale political scientists Alan Gerber and Donald Green said:
The public does seem to update its perceptions in the wake of events. When unemployment rises, the public's assessment of economic conditions sours.
And in a later article, Princeton professor Larry Bartels found:
…a slight improvement in evaluations of Bush's (H.W.) economic performance among both Republicans and Democrats between the fall of 1990 and the summer of 1991, followed by a marked decline in evaluations in both groups by the time of the 1992 elections.
Somewhere between 1992 and 2006, the situation had shifted such that Gerber and Yale's Gregory Huber show that "it appears that partisan differences are in place prior to the public event" such that "pre-election partisanship has a large and statistically significant effect on how respondents react to the outcome of the November 2006 election."
The latest YouGov/Economist poll found that 46 percent of Democratic primary voters thought the U.S. economy had recovered from the 2008 crisis, while only 4 percent of Republican primary voters thought a recovery had occurred.
On the standard "Overall, do you think the economy is getting better or worse?" question, 72 percent of Democrats thought it was the same or better, while only 42 percent of Republicans agreed, with independents in the middle at 50 percent (they held that the economy was better or not worse).
These partisan differences have compromised economic models, and in 2012 most economic models were off, with the two best known, the Fair and Hibbs models, also getting the result wrong. In 2016, the latest Fair prediction is 45 percent for Hillary Clinton.
If, in sum, the economy does not predict electoral success, then what does? The best answer is partisanship.
In the 2012 presidential election, the Democrats held a 6-point lead over Republicans, roughly 38 percent Democrat to 32 percent Republican, with 30 percent independent. Democrats voted 92 percent for Barack Obama and 7 percent for Mitt Romney, with Republicans voting 93 percent for Romney and 6 percent for Obama.
If the country had 100 million voters, these totals yield Obama 37 million votes (35 million from Democrats and 2 million from Republicans) and Romney 32.5 million (30 million from Republicans and 2.5 million from Democrats), which means that among the 30 million independents, Romney would have to win 4,500,000 more votes among independents to draw even with Obama's partisan edge, which is a 58 percent margin. He did not.
The 1976 and 1980 elections featured Democrats with large partisan leads of around 15 percent in both elections, but Jimmy Carter was not able to garner all the Democrats.
In 1976, 20 percent of Democrats voted for Gerald Ford (with 11 percent of Republicans voting for Carter), and in 1980 Carter lost one-third of Democrats to Reagan and third-party candidate John Anderson. Moreover, in both elections independents went Republican: 52 percent for Ford and 56 percent for Reagan.
Ford's close call and Reagan's win were not possible without partisan defections and winning margins among independents. Since 1980, every election without Ross Perot has yielded Republican loyalty of over 90 percent. The Democrats were not as quick to reach these loyalty levels, but by 2000 they were over 85 percent, and by the time of Obama, they could match the Republicans in loyalty.
In summary, presidential elections at the present time are won as in the 2012 presidential election, which Obama won because the Democrats held about a six-point advantage over Republicans (seven points in YouGov, six points in Exit Polls and Roper and six points in Gallup) and Obama won over 90 percent of Democrats while similar numbers of Republicans voted for Romney, who could not make up the difference among Independents.
As the eminent political scientist Gary C. Jacobson has documented, the same phenomenon occurred in down-ticket balloting.
"Record levels of party loyalty in the presidential contest carried over into House and Senate elections." Jacobsen notes.
So in this partisan atmosphere, how does the 2016 election stack up?
Beginning in May 2015, YouGov began surveying the same 5,000 people, and in late August/early September we ran the 13th wave with these respondents. In this essay, the purpose is to look at the 2016 election, using the 2012 election as the model.
This means that the important elements are the distribution of party identification, the degree to which Clinton and Trump can match Obama and Romney in capturing their partisan base and, finally, how independent voters, including leaning Democrats and leaning Republicans, are going to vote.
We divided the 13 surveys into three electoral periods: the pre-nomination campaign period (May 2015 to December); the primary electoral period (January to early June), which gave us the two nominees; and the campaign pre-Labor Day (June to early September). Table 1 shows the basic breakdown of party identification over the three periods.
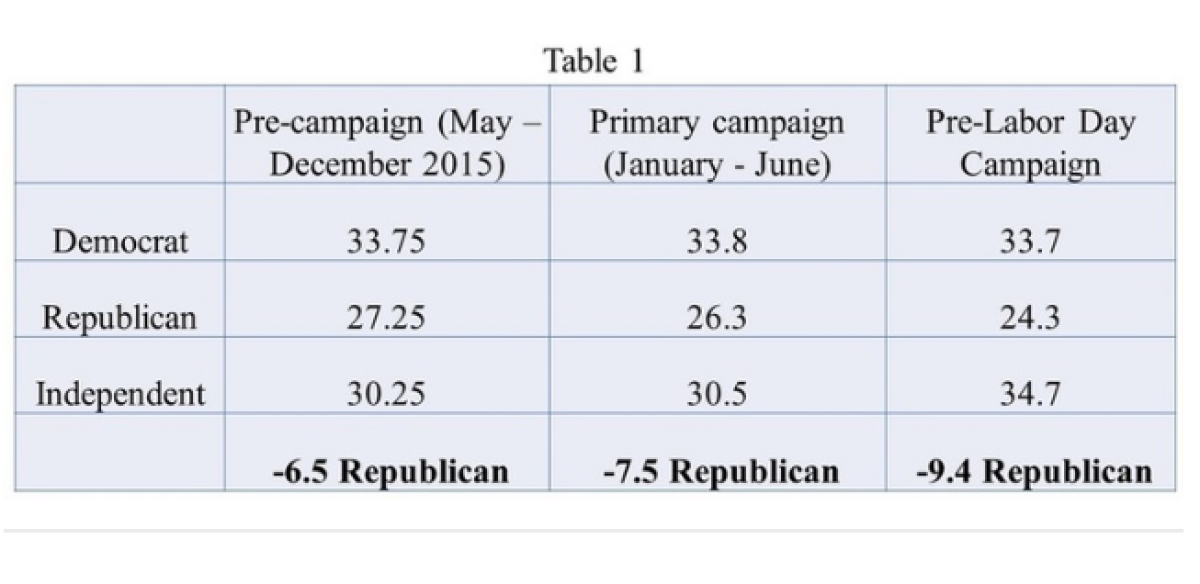
These results put the Republicans in worse shape than they were in 2012 because they now have a 9.4 percent gap, compared with a 6-point gap in 2012. (The gap was 8.4 on pollster.com, and, including leaners, it was 7 points in Gallup, both higher than 2012.)
If Clinton has Obama's 90 percent plus of Democrats, then she will be hard to beat, because Trump would have to win over 60 percent of independents, and that has been done only twice by Republicans in the modern era: Nixon with 61 percent in 1972 and Reagan with 63 percent in 1984.
Table 2 shows how Clinton and Trump do in head-to-heads over the three time periods by party identification.
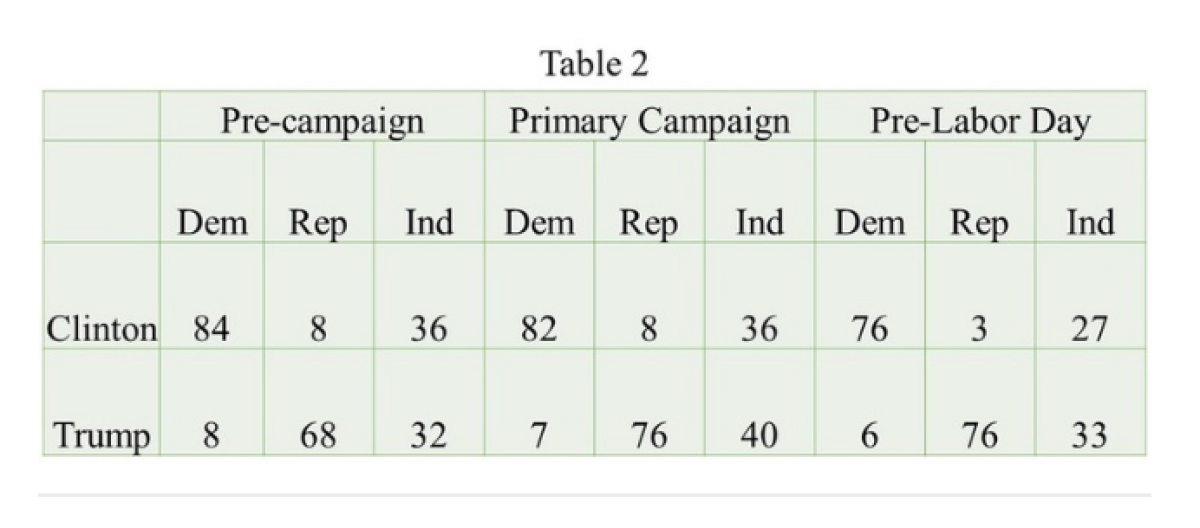
These data show that over the course of the campaign, Clinton's percentage of Democrats is declining from 84 to 76 percent, while Trump's share of Republicans is increasing from 68 to 76 percent. Moreover, he has twice as many Democrats (6 percent) as she has Republicans (3 percent), and she is no longer winning independents.
The good news for her is that the gap between Democrats and Republicans is now larger, which, given that she has the same share of her party as he has of his, means he has to capture a bigger share of the independent vote than he now has to win.
Breaking the party variable down, Clinton's problem is not with strong Democrats but, rather, with those who classify themselves as weak Democrats or leaning Democratic, where, in our most recent survey, only 58 percent were committed to her. (Trump, Libertarian Gary Johnson and Green Party candidate Jill Stein were at 5 percent each, with about 25 percent saying they were uncertain or won't vote.)
Trump has 90 percent of strong Republicans with him, but only 66 percent of weak and leaning Republicans, with Johnson at about 10 percent and another 16 percent saying they are undecided or won't vote.
Thus, neither candidate has reached the Obama/Romney party loyalty levels of 2012.
While there are many unique features about the 2016 election—the first female nominee of a major party, Trump himself, Bernie Sanders, the number of voters dissatisfied with the system—the major such feature going into the past two months of the campaign is the number of voters who claim they will vote for a third party, are not going to vote or are undecided.
In January, we started tracking this, and from then until early June, when we had the nominees, that number was about 20 percent. However, once it was clear that either Trump or Clinton would be president, the numbers saying third party, won't vote or undecided jumped.
In May, there were 19 percent of voters who were not for either Trump or Clinton; in June that number went to 24 percent; and in July and August, 31 percent were so categorized (10 percent third party or other voters, 10 percent who won't vote and 11 percent undecided).
This is a very, very large number, given recent electoral experience. For example, in August 2012, the best guess among experts was that "the actual share of voters who are up for grabs is probably between just 3 percent and 5 percent" (New York Times, August 16, 2012), which means in 2016 there are six to 10 times as many voters who could vote for either Trump or Clinton.
Third-party candidate poll numbers normally fall the closer you get to the second Tuesday in November, and many undecided and won't-vote people come around to vote. Given the expectation that, come November, many of these voters will vote for major party candidates, we attempted to ascertain their preference between Clinton and Trump.*
We combined the 750-odd respondents (31 percent) not voting for Trump or Clinton—due to support for a third-party candidate or being undecided, or stating they won't vote—and asked them (and only them): If you had to choose between Hillary Clinton or Donald Trump, who would you be more likely to vote for: her or him?
The result was that 63 percent had a preference, and Clinton won 39 to 24 percent, indicating, that among our non-Clinton/Trump voters, she has an advantage.
Johnson voters split, with both Clinton and Trump at 27 percent, and 46 percent saying no preference. Stein voters split 56 to 12 percent for Clinton, and undecided voters give Clinton a 37 to 32 percent advantage.
Finally, those saying that they won't vote give Clinton a 43 to 20 percent advantage over Trump. In short, this means that in early September, the "up for grabs voters," if they were to vote, would give Clinton some needed support.
The 37 percent who did not choose to answer the "if you had to vote" question are distinct from the overall sample in their dislike of both candidates. The no preference for Clinton or Trump (31 percent) respondents, when asked, "Regardless of whether you agree with her (him), do you like Hillary Clinton (Donald Trump) as a person?," responded with 45 percent liking Clinton, while 48 percent disliked her. For Trump, the numbers were 41 like and 52 dislike.
Those choosing not to vote (the 37 percent) responded with 23 percent liking Clinton and about 60 percent disliking her, while the same numbers for Trump are slightly worse, at 22 and 65 percent, respectively.
More specifically, these respondents were much more likely to characterize Clinton as dishonest and insincere, and Trump as unqualified for the job, a bully and someone who does not understand the problems of average people.
Given these negative views toward both candidates, it would seem some extraordinary event or events will be needed to move these potential voters toward either major candidate.
In sum, the Democrats have a bigger advantage than they did in 2012 because their margin over Republicans has increased. Clinton has not yet sealed the deal with weak and leaning Democrats, and until she reaches Obama's 90 percent-plus of Democrats in 2012, the race will remain fluid.
Trump has the same problem with weak and leaning Republicans and is well short of Romney's 93 percent-plus 2012 numbers. However, because there are fewer Republicans, his situation is more dire. Among independents indicating a preference for president, Trump leads Clinton, but by nowhere near enough to make up for the partisan gap.
Normally, we could conclude, given these numbers and analyses, that the election is close to over.
However, the 31 percent of respondents who are voting for third parties, undecided or say they won't vote keeps us from concluding that the election is on the way to decided. While it is true that, when pushed to vote, the 31 percent prefer Clinton to Trump, at 39 to 24 percent, this preference is not strong, and more than one-third of these respondents still won't state a preference.
These data show that in early September, Clinton holds a small lead, but it is not conclusive, and she will have to firm up her support among Democrats and continue to stay close to Trump among independents and undecideds in order to win.
Trump also has to shore up his Republican Party support and begin to increase his percentage of independent voters by converting the undecided to him. Of the two candidates, he has the longer row to hoe.
*The assumption is that turnout in the 2016 election will be similar to turnout in previous presidential elections. Turnout among registered voters in such elections is between 80 and 85 percent, and our analysis assumes this result. We looked at state-by-state registration numbers and have not found much evidence of major changes. In three states, Pennsylvania, Florida and North Carolina, Republican registration as of late August was up, but Democrats still had large margins in each state. In Florida, there were 5.21 million Democrats, 4.79 million Republicans and 3.69 million other/independents (Saint Petersburg Blog, September 14, 2016). In Pennsylvania as of September 5, there were 4,094,125 Democrats, 3,175,302 Republicans and 1,123,664 others, giving the Democrats a 918,823-vote advantage (according to the state of Pennsylvania). In North Carolina, Republicans cut the Democrats' lead from slightly over 800,000 to 645,000 voters as of late August. In other battleground states, Colorado has become more Democratic, while in Nevada and Arizona the Republican lead has shrunk. Registration drives for both parties are in full swing, with most states not closing registration until 30 days before the election.
David Brady is the Bowen H. and Janice Arthur McCoy professor of political science at the Stanford Graduate School of Business and the Davies Family senior fellow at the Hoover Institution.
Uncommon Knowledge
Newsweek is committed to challenging conventional wisdom and finding connections in the search for common ground.
Newsweek is committed to challenging conventional wisdom and finding connections in the search for common ground.
About the writer
To read how Newsweek uses AI as a newsroom tool, Click here.

