COVID-19 is still sweeping across the U.S., especially in the Midwestern and Great Plains states, despite recent declines in case numbers.
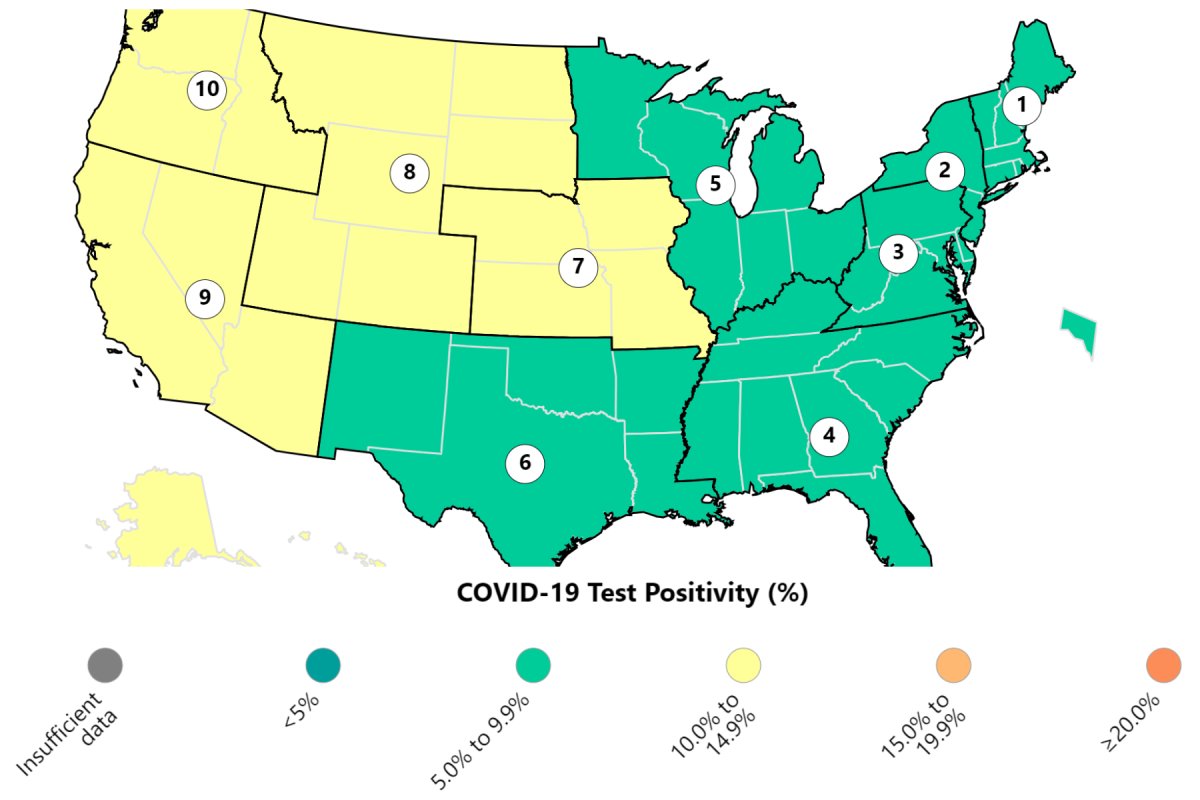
Maps from the Centers for Disease Control and Prevention (CDC) showing COVID-19 cases across the country reveal that, as of the week ending October 28, the U.S. had a 9 percent test positivity rate. In the week ending October 21, this was 8.7 percent.
The SARS-CoV-2 virus has been constantly evolving since the pandemic began in 2019, with small genetic mutations spawning new genetic variants of the pathogen.
"[The Arcturus (XBB.1.16)] variant is no longer the predominant variant in the U.S. The most prevalent is EG.5," Prakash Nagarkatti, a professor of immunology at the University of South Carolina, told Newsweek. Variants EG.5 and HV.1 make up around half of the current COVID-19 cases in the country, with HV.1 increasing over recent weeks to catch up to EG.5 in numbers.
The CDC data also shows that Colorado, Montana, North Dakota, South Dakota, Utah and Wyoming have the highest case rates at 12.6 percent average over the week before October 28. Iowa, Kansas, Missouri and Nebraska had case positivity rates of 11.3 percent, while Arizona, California, Hawaii, Illinois, Indiana, Michigan, Minnesota, Nevada, Ohio, and Wisconsin all had case rates of 11 percent.
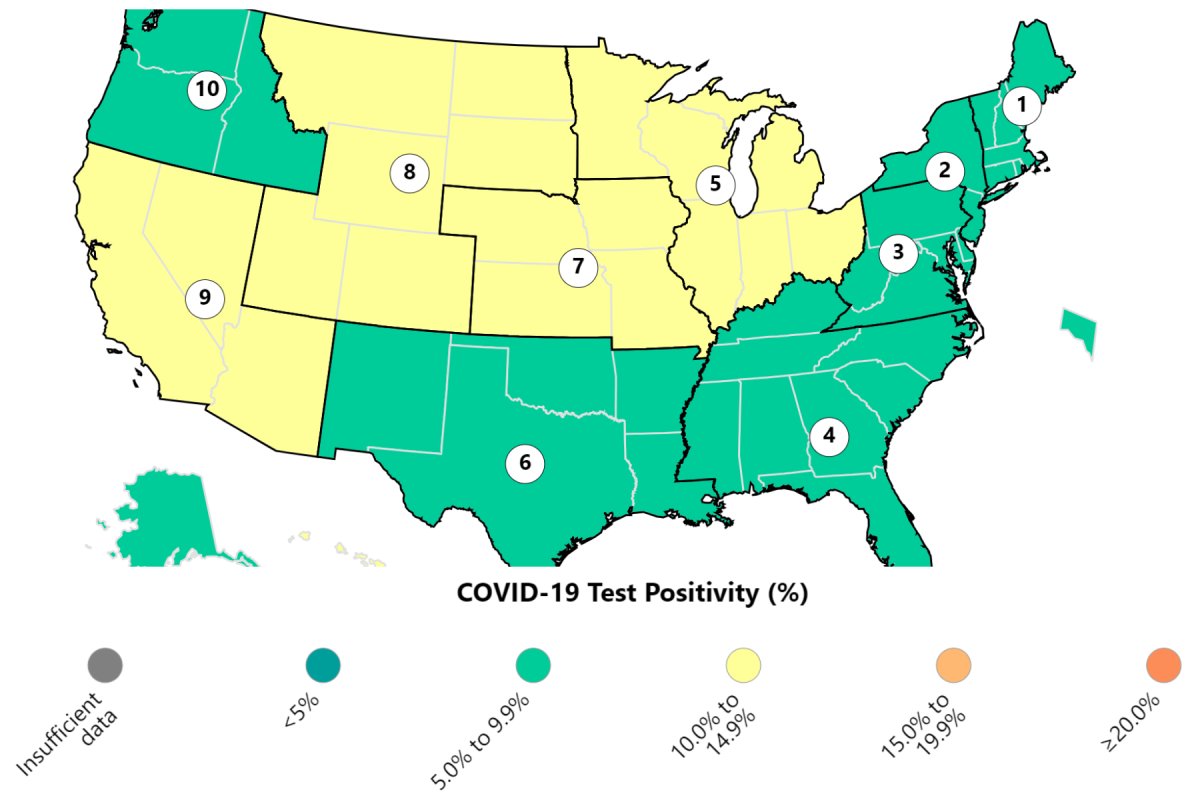
The states with the lowest case positivity rates include Delaware, Maryland, Pennsylvania, Virginia and West Virginia at 5.6 percent; and Alabama, Florida, Georgia, Kentucky, Mississippi, New Jersey, New York, North Carolina, South Carolina, and Tennessee, at 6.9 percent.
There were 15,745 COVID-related hospitalizations in the U.S. over the week before October 28, down slightly from the 16,186 the week prior. This equates to around 4.74 per 100,000 people across the country. Worst hit were New York with 1,254 new hospitalizations, California with 1,551, and Texas with 1,209.
Deaths from COVID-19 have dropped, however, with 2.5 percent of deaths being due to the virus, compared to 2.7 percent the week before. Kentucky was one of the worst-affected states, with 4.8 percent of deaths being due to COVID-19, a 23.1 percent jump from the prior week.
Infections may jump up again as we enter winter, as other viruses and illnesses may weaken immune systems and allow COVID-19 to infect the public more easily. A new batch of coronavirus vaccines was made available to the population only a few months ago. However, only 7 percent of adults and 2 percent of children received the new boosters.
Do you have a tip on a science story that Newsweek should be covering? Do you have a question about new COVID-19 cases? Let us know via science@newsweek.com.
Uncommon Knowledge
Newsweek is committed to challenging conventional wisdom and finding connections in the search for common ground.
Newsweek is committed to challenging conventional wisdom and finding connections in the search for common ground.
About the writer
Jess Thomson is a Newsweek Science Reporter based in London UK. Her focus is reporting on science, technology and healthcare. ... Read more
To read how Newsweek uses AI as a newsroom tool, Click here.