States in the U.S. have wildly different average income amounts, with some households in a poorer state earning on average tens of thousands of dollars less than those in wealthier states.
The U.S. has a median annual household income of $74,755, according to the 2022 American Community Survey conducted by the U.S. Census Bureau. But some states have considerably higher, or lower, rates of income than others. The data shows that households in some of the lowest states have average incomes almost $50,000 less than those in the highest.
The U.S. Census Bureau measures median household income as the total gross income of all persons 15 years or older living in a household. Measures include wages and salaries, unemployment insurance, disability payments, child-support payments, rental income, as well as any personal business, investment, or other types of routinely received income.
Which States Have the Highest Income?
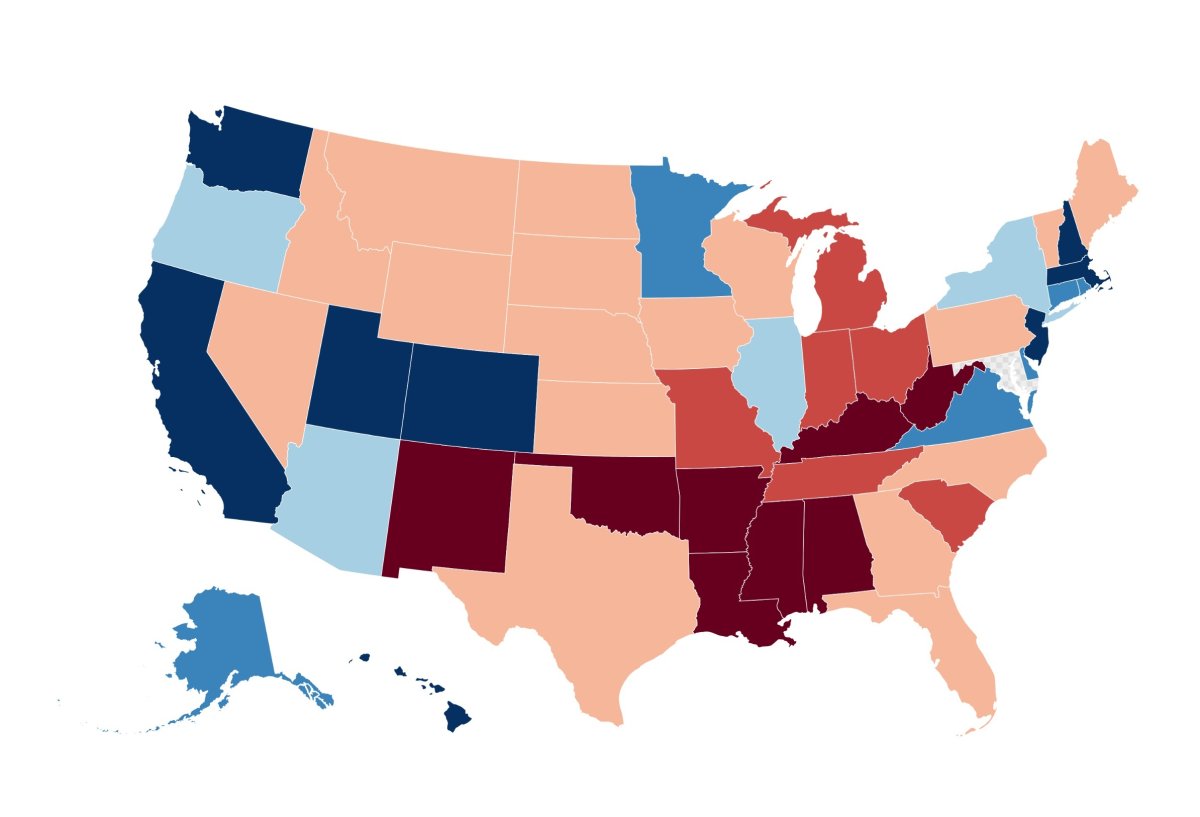
New Jersey has the highest median household income of $96,346, closely followed by Massachusetts with an average annual income of $94,488 per year. The top five also comprises of Hawaii ($92,458), California ($91,551), and Washington ($91,306).
Although not a state, Washington D.C. boasts the highest median income of all: $101,027 per year.
Which States Have the Lowest Income?
By the median income standard, Mississippi is poorest state in the U.S., with a household average income of $52,985. It is closely followed by West Virginia, with an average of $55,217, and Arkansas with an income rate of $56,335, as of 2022.
World Population Review says Mississippi also has the highest poverty rate in the country: 19.4 percent in 2024. For a decade, the Magnolia State has ranked as the hungriest state in the U.S., according to a report by the Harvard Gazette.
The only state that is not ranked is Maryland, for which there is no data available according to the U.S. Census Bureau.
Despite only Washington D.C. breaching the $100,000 mark for annual household earnings, the percentage of homes earning more has steadily risen, despite a small fallback during the coronavirus pandemic. A 2023 report by IBIS World said, in the five years to 2022, the percentage of households earning more than $100,000 per year increased an estimated 2.97 percentage points.
Boosted by more high-paying jobs becoming available in technology and financial industries, continuous strong demand for higher education and technology-driven growth in worker productivity, as well as rising inflation rates post-coronavirus, have all been cited as causes for the steady increase.
However, despite the U.S. having more than $135 trillion in total wealth, 11.5 percent of the population was reported as living in poverty in 2022, according to the U.S. Census Bureau.
Average Household Income by U.S. State
State | Median Household Income | Margin of Error |
Alabama | $59,674 | ± $727 |
Alaska | $88,121 | ± $2,804 |
Arizona | $74,568 | ± $932 |
Arkansas | $55,432 | ± $994 |
California | $91,551 | ± $471 |
Colorado | $89,302 | ± $1,281 |
Connecticut | $88,429 | ± $1,688 |
Delaware | $82,174 | ± $2,002 |
D.C. | $101,027 | ± $2,737 |
Florida | $69,303 | ± $616 |
Georgia | $72,837 | ± $640 |
Hawaii | $92,458 | ± $2,241 |
Idaho | $72,785 | ± $1,134 |
Illinois | $76,708 | ± $584 |
Indiana | $66,785 | ± $659 |
Iowa | $69,588 | ± $889 |
Kansas | $68,925 | ± $1,152 |
Kentucky | $59,341 | ± $924 |
Louisiana | $55,416 | ± $800 |
Maine | $69,543 | ± $1,494 |
Maryland | No data | n/a |
Massachusetts | $94,488 | ± $1,260 |
Michigan | $66,986 | ± $675 |
Minnesota | $82,338 | ± $749 |
Mississippi | $52,719 | ± $895 |
Missouri | $64,811 | ± $733 |
Montana | $67,631 | ± $1,496 |
Nebraska | $69,597 | ± $1,168 |
Nevada | $72,333 | ± $1,026 |
New Hampshire | $89,992 | ± $2,310 |
New Jersey | $96,346 | ± $1,114 |
New Mexico | $59,726 | ± $1,306 |
New York | $79,557 | ± $722 |
North Carolina | $67,481 | ± $623 |
North Dakota | $71,970 | ± $2,072 |
Ohio | $65,720 | ± $618 |
Oklahoma | $59,673 | ± $689 |
Oregon | $75,657 | ± $1,181 |
Pennsylvania | $71,798 | ± $557 |
Rhode Island | $81,854 | ± $2,182 |
South Carolina | $64,115 | ± $699 |
South Dakota | $69,728 | ± $2,128 |
Tennessee | $65,254 | ± $848 |
Texas | $72,284 | ± $443 |
Utah | $89,168 | ± $1,807 |
Vermont | $73,991 | ± $2,209 |
Virginia | $85,873 | ± $763 |
Washington | $91,306 | ± $841 |
West Virginia | $54,329 | ± $1,336 |
Wisconsin | $70,996 | ± $644 |
Wyoming | $70,042 | ± $2,867 |
Uncommon Knowledge
Newsweek is committed to challenging conventional wisdom and finding connections in the search for common ground.
Newsweek is committed to challenging conventional wisdom and finding connections in the search for common ground.
About the writer
Aliss Higham is a Newsweek reporter based in Glasgow, Scotland. Her focus is reporting on issues across the U.S., including ... Read more
To read how Newsweek uses AI as a newsroom tool, Click here.